Ameerpet Hyderabad

Call Now : 9390612347

Dilsukhnagar Hyderabad

Call Now : 8096061003

Mehdipatnam Hyderabad

Call Now : 9000709021

Power BI vs Advanced Excel: What Should Beginners Learn First?

Data plays an important role in modern businesses. Companies collect information about sales, customers, products, expenses, employees and operations. However, collecting data alone is not enough. Businesses must organise it, analyse it and convert it into useful information for decision-making.

Two popular tools used for data analysis and business reporting are Advanced Excel and Microsoft Power BI.

Both tools help users work with data, create visual reports and identify trends. However, they have different strengths and are useful for different types of tasks.

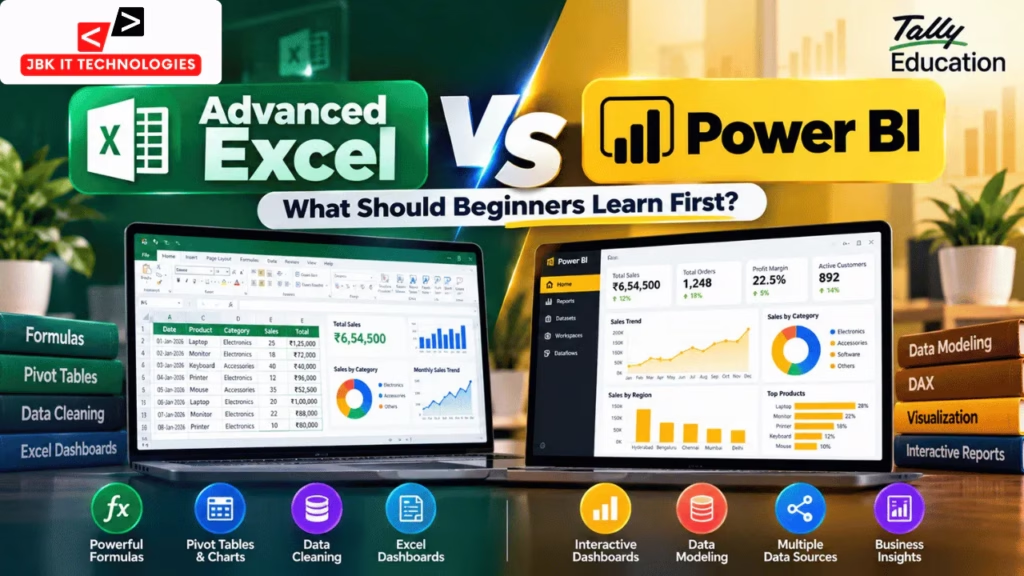
This raises a common question among beginners: Power BI vs Advanced Excel — what should you learn first?

For most beginners, learning Excel first is a practical approach. Excel helps build a foundation in formulas, data cleaning, calculations, PivotTables and basic reporting. After understanding these concepts, learners can move to Power BI for interactive dashboards, data modeling and business intelligence reporting.

What Is Advanced Excel?

Advanced Excel refers to using Excel beyond basic data entry and simple calculations. It includes formulas, data cleaning, lookup functions, PivotTables, charts, conditional formatting and reporting techniques.

Businesses use Excel to organise information, perform calculations, analyse records and prepare reports.

For example, an organisation may maintain an Excel workbook containing monthly sales, product details, customer information and expenses. An analyst can use formulas and PivotTables to calculate revenue, compare regions and identify the best-performing products.

Important Advanced Excel skills

1. Formulas and functions

Beginners should understand functions such as:

  • SUM and AVERAGE

  • IF and IFS

  • COUNTIF and SUMIF

  • SUMIFS and COUNTIFS

  • XLOOKUP and VLOOKUP

  • IFERROR

  • Date and text functions

These functions help automate calculations and retrieve information from datasets. Microsoft’s Excel documentation provides examples of formulas for calculations, lookup tasks, dates and other common operations. <sup>Microsoft Support</sup>

2. Data cleaning

Real-world datasets may contain duplicate records, missing values, inconsistent dates, extra spaces and incorrectly formatted numbers.

Excel can help users identify and correct these problems using sorting, filtering, text functions, data validation and Power Query.

3. PivotTables and PivotCharts

PivotTables help summarise data by categories, dates, products or regions. PivotCharts display those summaries visually, making comparisons and trends easier to understand. <sup>Microsoft Support</sup>

4. Excel dashboards

An Excel dashboard brings important metrics and charts together on one worksheet.

A sales dashboard might show total revenue, monthly growth, top-selling products, regional performance and sales targets.

5. Reporting and analysis

Excel is useful for preparing structured reports, checking individual records, calculating business metrics and sharing spreadsheet-based analysis.

These skills make Advanced Excel an important starting point for learners interested in reporting, accounting, operations and data analytics.

What Is Microsoft Power BI?

Microsoft Power BI is a business intelligence platform used to connect to data, transform it, create data models and develop interactive reports.

Instead of manually building every report from individual spreadsheet cells, users can create a reusable reporting model and design visualisations that help users explore business performance.

Power BI Desktop includes report, table and model views, along with Power Query Editor for preparing and transforming data. <sup>Microsoft Learn</sup>

Important Power BI skills

1. Connecting to data sources

Power BI can connect to supported data sources, including Excel files and databases. This helps users bring information from different systems into a reporting environment.

2. Power Query

Power Query is used to clean, transform and combine data before analysis. It helps users standardise columns, change data types, remove unwanted rows and prepare information for reporting. <sup>Microsoft Learn</sup>

3. Data modeling

Data modeling involves organising tables and creating relationships between them.

For example, a sales dataset can be connected to product, customer and calendar tables. This structure allows a report to analyse sales from different perspectives.

4. DAX calculations

Data Analysis Expressions, or DAX, is used to create measures and calculations in Power BI data models.

Examples include total sales, profit margin, year-to-date sales and year-over-year growth.

5. Interactive Power BI dashboards and reports

Power BI reports can include charts, cards, slicers, tables and other visual elements. Users can filter data and explore different views of business performance.

Power BI is particularly useful when an organisation needs repeatable reporting, multiple related datasets and interactive business intelligence reports.

Power BI vs Advanced Excel: Key Differences

FeatureAdvanced ExcelPower BI
Main purposeSpreadsheet calculations and analysisBusiness intelligence and interactive reporting
FormulasExcel functionsDAX measures and calculated columns
Data cleaningExcel tools and Power QueryPower Query
Data summariesPivotTables and formulasVisuals, measures and data models
DashboardsWorksheet-based dashboardsInteractive multi-page reports
Data modelingTables, relationships and available data-model featuresCentral part of report development
Record-level inspectionConvenient in worksheetsAvailable through tables and detailed report views
AutomationFormulas, Power Query and other Excel featuresRefreshable data transformations and reports
Common outputWorkbooks and spreadsheet reportsInteractive reports and published dashboards
Beginner learning curveOften easier to start withRequires understanding data preparation and modeling
Typical use casesCalculations, reconciliation, detailed analysisBusiness intelligence and recurring management reports

These are general differences, not absolute limitations. Excel also supports sophisticated data models and advanced analysis, while Power BI can display detailed tables and individual records. The best tool depends on the task.

Excel Dashboards vs Power BI Dashboards

Dashboards are one of the most important topics in the Power BI vs Advanced Excel comparison.

Both tools can present important business metrics visually, but their workflows differ.

Excel dashboards

An Excel dashboard is usually built inside a workbook using charts, formulas, PivotTables, slicers and formatted cells.

It is useful when:

  • Data is already maintained in spreadsheets.

  • Users need calculations alongside reports.

  • The report requires detailed cell-level analysis.

  • A small team shares workbook-based information.

  • Users need to adjust formulas or inspect individual records.

Example: An accountant creates a monthly expense dashboard showing department budgets, actual spending and differences.

Power BI dashboards and reports

Power BI is useful when users need to combine datasets, model relationships and build interactive reports.

It is useful when:

  • Data comes from multiple sources.

  • Management needs interactive reports.

  • Reports must be refreshed regularly.

  • Users need to explore performance by date, region or product.

  • The organisation needs a reusable business intelligence model.

Example: A sales manager opens a report, selects a region and compares revenue, profit and sales targets across several months.

The practical difference is that Excel is particularly flexible for spreadsheet analysis, while Power BI is designed around interactive data models and reporting workflows.

Which Tool Is Better for Data Cleaning?

Data cleaning is necessary before any meaningful analysis.

Suppose a sales file contains 5,000 rows. Some customer names have inconsistent spelling, several dates are stored as text, and a few rows are duplicated.

In Excel, a beginner can use filters, conditional formatting, formulas, Remove Duplicates and Power Query to clean the information.

In Power BI, Power Query can be used to transform the dataset before it enters the data model.

An important advantage of learning Power Query is that similar transformation concepts are available in both Excel and Power BI, although availability and interface details can vary by product and version. <sup>Microsoft Power Query documentation</sup>

For beginners, the best approach is to learn the principles of data cleaning first and then practise them in both tools.

Which Tool Is Better for Data Analysis?

The answer depends on the analysis.

Excel is useful for calculations, checking individual records, performing ad hoc analysis and preparing spreadsheet reports.

Power BI is useful for building reusable data models and exploring business metrics through interactive reports.

Consider a company with sales data for several products across multiple regions.

In Excel, an analyst can calculate revenue using formulas, summarise sales with a PivotTable and create a chart.

In Power BI, the analyst can model sales, products, regions and dates, then create measures and report visuals that users can filter interactively.

Both tools can answer important business questions. The difference is the workflow and scale of reporting required.

Real-World Example: Sales Dashboard

Imagine a company selling laptops, monitors and accessories in different cities.

Its sales dataset includes:

  • Order date

  • Product name

  • Salesperson

  • City

  • Quantity

  • Selling price

  • Cost

  • Revenue

Step 1: Use Excel to prepare the data

Start by checking missing values, duplicate orders, incorrect dates and inconsistent product names.

Then calculate revenue and profit using suitable formulas.

For example:

Revenue = Quantity × Selling Price

Profit = Revenue − Total Cost

Create a PivotTable to summarise monthly sales and compare products.

Step 2: Build an Excel dashboard

Add key metrics such as:

  • Total revenue

  • Total profit

  • Monthly sales

  • Best-selling product

  • Sales by city

Use charts and filters to make the report easier to understand.

Step 3: Move the dataset into Power BI

Import the cleaned Excel data into Power BI. Use Power Query if further transformation is needed.

Create relationships between tables if the project uses separate sales, product and calendar datasets.

Step 4: Build a Power BI report

Add cards for revenue and profit, a line chart for monthly trends, a bar chart for product performance and a map or regional chart where appropriate data is available.

Add slicers so users can explore results by date, city or product.

This project teaches both Excel dashboards and Power BI dashboards while showing how spreadsheet analysis can lead into business intelligence reporting.

Should Beginners Learn Excel Before Power BI?

For most beginners, yes — learning Excel first is a practical recommendation.

Excel introduces many fundamental concepts used in data analytics, including rows, columns, data types, formulas, filtering, summarisation and charts.

A beginner who understands these concepts may find it easier to learn Power Query, data modeling and DAX later.

However, you do not need to master every advanced Excel feature before starting Power BI. Once you understand basic data handling, formulas, PivotTables and data cleaning, you can begin learning Power BI while continuing to improve your Excel skills.

Recommended learning order

  1. Excel fundamentals: worksheets, tables, sorting, filtering and formulas.

  2. Advanced Excel: lookup functions, conditional formulas, PivotTables, charts and reporting.

  3. Data cleaning: duplicates, missing values, data types and Power Query.

  4. Power BI fundamentals: importing data, Power Query and report visuals.

  5. Data modeling: relationships, fact tables and dimension tables.

  6. DAX: measures and calculations for business metrics.

  7. Dashboard projects: build and explain reports using realistic datasets.

This sequence helps learners develop practical skills without getting stuck trying to master one tool completely before moving forward.

Which Tool Is More Useful for Jobs?

Excel and Power BI are both useful in many data-related roles, but their relevance varies by job description and organisation.

Roles where Excel is commonly useful

  • MIS Executive

  • Reporting Executive

  • Accounts Executive

  • Operations Executive

  • Business Support Executive

  • Junior Data Analyst

These roles may involve spreadsheet reporting, calculations, data validation, reconciliations and recurring business reports.

Roles where Power BI may be especially useful

  • Power BI Developer

  • Data Analyst

  • Business Intelligence Analyst

  • Reporting Analyst

  • Business Analyst

These roles may involve data modeling, dashboard development, DAX, data transformation and business intelligence reporting.

These are examples rather than guaranteed career paths. Employers may also expect SQL, domain knowledge, communication skills and experience with other tools.

Skills to Learn Alongside Excel and Power BI

To build stronger data analysis skills, consider learning the following topics.

SQL

SQL helps users retrieve and analyse data stored in relational databases. It is especially useful when working with data that is not already available in a spreadsheet.

Business metrics

Understand common metrics such as revenue, profit margin, growth rate, average order value and target achievement.

Data visualization

Learn how to choose suitable charts, use clear labels, avoid misleading scales and highlight important findings.

Communication

A good analyst should be able to explain what the data means, why a trend matters and what questions the business should investigate next.

Practical projects

Create reports using realistic datasets rather than only following tutorials. Projects help demonstrate that you can clean data, perform calculations and communicate findings.

Step 7: Learn Inventory Management

Inventory management is important for businesses that deal with physical goods.

TallyPrime supports inventory-related processes such as stock tracking, godowns, batches, order processing and stock valuation.

Important topics for beginners include:

  • Stock groups
  • Stock categories
  • Stock items
  • Units of measurement
  • Godowns
  • Opening stock
  • Purchase of stock
  • Sale of stock
  • Stock transfer
  • Stock adjustments
  • Inventory reports

For example, if a business sells 10 units of a product, the inventory records should reflect the corresponding stock movement.

A 30-Day Learning Plan for Beginners

This plan provides a starting structure. The pace can be adjusted according to your available study time and previous experience.

DaysTopicsPractice Task
1–5Excel basics, tables, sorting and filteringOrganise a sales dataset
6–10Formulas, IF, SUMIFS and lookup functionsCalculate revenue and profit
11–15PivotTables, charts and dashboardsCreate a monthly sales report
16–18Data cleaning and Power QueryClean and transform a dataset
19–22Power BI data import and visualsCreate your first report
23–26Data modeling and DAX basicsCalculate sales and profit measures
27–30Final project and presentationBuild an interactive sales report

By the end of this plan, beginners should aim to have one Excel dashboard and one Power BI report they can explain. The plan is a learning framework, not a guarantee of job readiness within 30 days.

Learning Advanced Excel and Power BI in Hyderabad

Students searching for a Power BI and Advanced Excel course in Hyderabad should look for practical training that covers both spreadsheet analysis and business intelligence.

A useful syllabus should include:

  • Excel formulas and functions

  • Lookup functions

  • PivotTables and charts

  • Data cleaning

  • Power Query

  • Excel dashboard creation

  • Power BI data import

  • Data modeling

  • DAX fundamentals

  • Interactive report development

  • Practical projects

Learners searching for Excel Power BI training in Dilsukhnagar should also check whether the course includes realistic datasets, guided assignments and opportunities to build projects independently.

The main objective should be to learn how to solve reporting problems, not simply how to use individual features.

Common Mistakes Beginners Should Avoid

1. Skipping Excel fundamentals

Starting Power BI without understanding basic data structures can make data preparation and calculations more difficult.

2. Focusing only on charts

Attractive visuals are not enough. Accurate data, appropriate calculations and clear business questions are essential.

3. Ignoring data cleaning

Incorrect dates, duplicates and inconsistent values can lead to misleading results.

4. Memorising DAX without understanding the data model

DAX calculations become easier to understand when you know how tables, relationships and filter context work.

5. Building dashboards without a purpose

Every dashboard should answer a question, such as which product generates the most revenue or which region is below target.

6. Learning without projects

Practical projects help you apply formulas, transformations, calculations and visuals to complete business problems.

Frequently Asked Questions

1. Should I learn Excel before Power BI?

For most beginners, yes. Learn Excel fundamentals, formulas, data cleaning and PivotTables first. You can then move into Power BI while continuing to improve your Excel skills.

2. Which is better, Excel or Power BI?

Neither tool is universally better. Excel is highly useful for spreadsheet calculations and detailed analysis, while Power BI is designed for data modeling and interactive business intelligence reporting.

3. Is Advanced Excel enough for data analysis?

Advanced Excel can handle many data analysis tasks. However, learning Power BI can help when you need interactive reports, reusable data models or reporting across multiple datasets.

4. Can I learn Power BI without Advanced Excel?

Yes. You can start Power BI without mastering all advanced Excel features. Basic spreadsheet knowledge and an understanding of data tables will make the learning process easier.

5. Are Excel dashboards and Power BI dashboards the same?

No. Both display important metrics and visualisations, but Excel dashboards are generally built within workbooks, while Power BI reports use data models and interactive report pages. Their capabilities overlap.

6. Is Power BI difficult for beginners?

Power BI can be learned step by step. Data import and basic charts are good starting points. Data modeling and DAX usually require additional practice.

7. Should I learn SQL after Excel and Power BI?

SQL is a useful next skill because it helps you retrieve and analyse information from databases. Excel, Power BI and SQL together can provide a strong foundation for many data analysis tasks.

8. Which tool is better for business reporting?

Excel is useful for spreadsheet-based reports and calculations. Power BI is particularly useful for interactive reports and repeatable business intelligence workflows. The best choice depends on the reporting requirement.

9. Can Excel data be used in Power BI?

Yes. Excel files can be imported into Power BI. Users can then transform the data, build relationships and create reports based on it.

10. Where can I learn Power BI and Advanced Excel in Hyderabad?

When comparing a Power BI and Advanced Excel course in Hyderabad, check the syllabus, trainer support, project work and opportunities to practise both tools. For local options, search for Excel Power BI training in Dilsukhnagar and compare the practical curriculum before choosing.

Enquiry Form