Ameerpet Hyderabad

Call Now : 9390612347

Dilsukhnagar Hyderabad

Call Now : 8096061003

Mehdipatnam Hyderabad

Call Now : 9000709021

SQL and Power BI: How They Work Together in Data Analytics

Businesses generate data every day through sales transactions, customer enquiries, online purchases, inventory systems, finance applications, and other business operations. However, collecting data is only the first step. Businesses also need to organise it, identify patterns, and present useful information to support decisions.

This is where SQL and Power BI become valuable.

SQL helps users retrieve, filter, combine, and summarise data stored in relational databases. Power BI helps users connect to data sources, prepare information, build data models, and create interactive reports and visualisations.

Although these tools perform different functions, they complement each other in data analytics. SQL can help answer questions such as which products generated the most sales, while Power BI taring Institute in Hyderabad can present the results through charts, trends, filters, and reports.

In this guide, you will learn how SQL and Power BI work together, understand a typical data analytics workflow, explore a practical sales reporting project, and discover the skills beginners should develop.

1. What Is SQL in Data Analytics?

SQL stands for Structured Query Language. It is a language used to work with data in relational database management systems.

Businesses often store information in tables containing rows and columns. For example, an online store might maintain separate tables for customers, orders, products, and payments.

SQL allows users to retrieve specific information from these tables without manually reviewing every record.

Common SQL tasks

Data retrieval: Use SELECT to choose the columns you need.

Data filtering: Use WHERE to return records that match specific conditions.

Sorting: Use ORDER BY to arrange results in ascending or descending order.

Aggregation: Use functions such as SUM(), COUNT(), and AVG() to summarise data.

Grouping: Use GROUP BY to calculate totals for categories such as products, regions, or months.

Joining tables: Use joins to combine related information from multiple tables.

Subqueries and common table expressions: Break complex questions into manageable query steps.

Example: Finding total sales by product

Suppose a company stores order details in a table named Sales, with columns for product name and sales amount.

A basic SQL query could look like this:

SELECT
    ProductName,
    SUM(SalesAmount) AS TotalSales
FROM Sales
GROUP BY ProductName
ORDER BY TotalSales DESC;

This query groups records by product, calculates total sales for each product, and sorts the results from highest to lowest.

The output is a summary table that can help an analyst identify the strongest-performing products.

Why SQL matters

SQL is useful when the amount of data becomes too large or complicated to manage manually. It also allows analysts to work directly with databases instead of relying exclusively on spreadsheets or exported files.

For beginners, learning SQL fundamentals builds an understanding of how business data is stored and retrieved. These skills are particularly useful when working with reporting tools such as Power BI.

2. What Is Power BI in Data Analytics?

Power BI is Microsoft’s business intelligence and data visualisation platform. It allows users to connect to supported data sources, prepare information, create data models, and build interactive reports.

Instead of presenting only rows and columns, Power BI can turn data into visual information that is easier for business users to explore.

For example, a sales manager might use a Power BI report to review monthly revenue, compare product categories, examine regional performance, and filter results by date.

Important Power BI features

Data connectivity: Connect to supported sources such as SQL Server, Excel files, and other databases or services.

Power Query: Prepare data by cleaning, transforming, combining, and reshaping it.

Data modeling: Create relationships between tables and organise the information used in reports.

DAX: Use Data Analysis Expressions to create calculations and measures.

Visualisations: Present information through charts, tables, cards, maps, and other supported visual elements.

Interactive reports: Add filters, slicers, drill-through features, and other ways for users to explore results.

Publishing and sharing: Publish reports to the Power BI service and share them according to the organisation’s access and licensing arrangements.

Microsoft’s documentation explains how Power BI connects to SQL Server using the Power Query SQL Server connector, with options including Import and DirectQuery for supported scenarios.

Example: Creating a sales report

Imagine that an organisation wants to monitor its monthly sales. A Power BI report could include:

  • A card showing total sales.

  • A line chart showing monthly sales trends.

  • A bar chart comparing product categories.

  • A table listing the best-performing products.

  • Slicers for date, region, and category.

The report helps users move from a collection of figures to a clearer view of business performance.

3. Why Combine SQL and Power BI?

SQL and Power BI solve different parts of the analytics process.

SQL is commonly used to retrieve and summarise information in databases. Power BI is used to prepare, model, visualise, and communicate insights from data.

When used together, they can support a more organised reporting workflow.

SQL handles database queries

A company may have millions of transaction records stored in a database. An analyst can use SQL to select the relevant columns, filter records, join related tables, and calculate summaries.

This reduces the need to manually inspect or manipulate every row.

Power BI makes the results easier to understand

After connecting to the required data, an analyst can use Power BI to develop a model and create reports that help people understand the results.

A manager may not need to read a long SQL query or examine thousands of transaction rows. They may need only a clear chart showing sales by month and category.

Together, they connect technical analysis with business decisions

The combination helps answer questions such as:

  • Which products generate the most revenue?

  • How does sales performance change month by month?

  • Which regions are below their targets?

  • How many customers made repeat purchases?

  • Which product categories contribute most to total revenue?

SQL can retrieve and prepare the relevant records, while Power BI can help present the answers in an interactive format.

4. SQL vs Power BI: Understanding the Difference

FactorSQLPower BI
Main purposeQuery and manage data in supported database systemsAnalyse and present data through reports and visualisations
Typical workFiltering, joining, grouping, and summarising recordsData preparation, modeling, calculations, and visual reporting
Main interfaceSQL queries and database toolsVisual report editor and data modeling interface
Common outputsQuery results and summary tablesInteractive reports, charts, and dashboards
Important conceptsSELECT, WHERE, joins, aggregation, subqueriesPower Query, relationships, DAX, visuals, filters
Primary usersData analysts, database professionals, developersData analysts, BI developers, business users
Best contributionRetrieves and structures relevant dataCommunicates patterns and insights visually

These tools are not direct replacements for each other. SQL is a language, while Power BI is a business intelligence platform with multiple capabilities.

A Power BI user can work with data from sources that do not require writing SQL. Similarly, SQL can be used for reporting tasks without Power BI. The combination is particularly useful when business data is stored in relational databases and needs to be presented through interactive reports.

5. How SQL and Power BI Work Together: Step-by-Step Workflow

A typical workflow begins with a business question and ends with a report that helps users make decisions.

Step 1: Understand the business requirement

Before writing a query or designing a report, identify what the business needs to know.

For example, a retail company might ask:

  • What were total sales this month?

  • Which category performed best?

  • How does this month’s revenue compare with the previous month?

  • Which regions need attention?

These questions determine which tables, fields, calculations, and visualisations are needed.

Step 2: Identify the data source

The required information might be stored in a SQL Server database or another supported database system.

The analyst needs to identify the server, database, tables, relevant columns, and appropriate access permissions.

For a sales report, the data might include order dates, product IDs, quantities, unit prices, customer IDs, and region IDs.

Step 3: Use SQL to retrieve relevant data

Write queries to select the required columns, apply filters, combine related tables, and create useful summaries.

For example, an analyst may join order details with product information to calculate sales by category.

The goal is to retrieve data that answers the business question without unnecessarily including unrelated information.

Step 4: Connect Power BI to the database

In Power BI Desktop, select the appropriate data connector, provide the required connection details, and authenticate using an authorised method.

For SQL Server, Power BI supports Import and DirectQuery modes in supported configurations. The choice depends on data size, freshness requirements, model design, and performance considerations.

  • Import: Data is loaded into the Power BI model and refreshed according to the configured refresh process.

  • DirectQuery: Power BI queries the underlying data source when users interact with supported reports, subject to connector and model limitations.

Neither mode is automatically best for every project. The right choice depends on the system and reporting requirements.

Step 5: Clean and transform the data

Use Power Query to address issues such as incorrect data types, unnecessary columns, inconsistent text, and missing values.

For example, dates should be recognised as dates rather than text, and sales amounts should use an appropriate numeric data type.

SQL can handle many transformations before data reaches Power BI. Power Query can handle additional transformations within the reporting workflow. The best place for each transformation depends on performance, maintainability, and the requirements of the project.

Step 6: Create a data model

A report may use multiple related tables, such as Sales, Products, Customers, and Calendar.

Create appropriate relationships between the tables. Check the uniqueness of key columns, relationship direction, and table grain so that calculations return correct results.

A well-designed model helps Power BI calculate totals consistently and supports useful filtering across report visuals.

Step 7: Create calculations and visualisations

Use DAX measures when you need calculations that respond to report filters, such as total revenue, order count, average order value, or year-to-date sales.

Then create visuals that match the business questions.

For example, a line chart can show monthly revenue, while a bar chart can compare sales by category. Slicers can allow users to focus on particular dates or regions.

Step 8: Validate and share the report

Compare the report’s totals with trusted source data or independently checked SQL results. Check for duplicate records, missing dates, incorrect joins, and unexpected totals.

After validation, publish the report to the appropriate Power BI workspace and configure access and refresh settings as required.

Microsoft distinguishes interactive Power BI reports from dashboards in the Power BI service. Reports can contain multiple pages and interactive features, while service dashboards provide a single-page view of selected highlights.

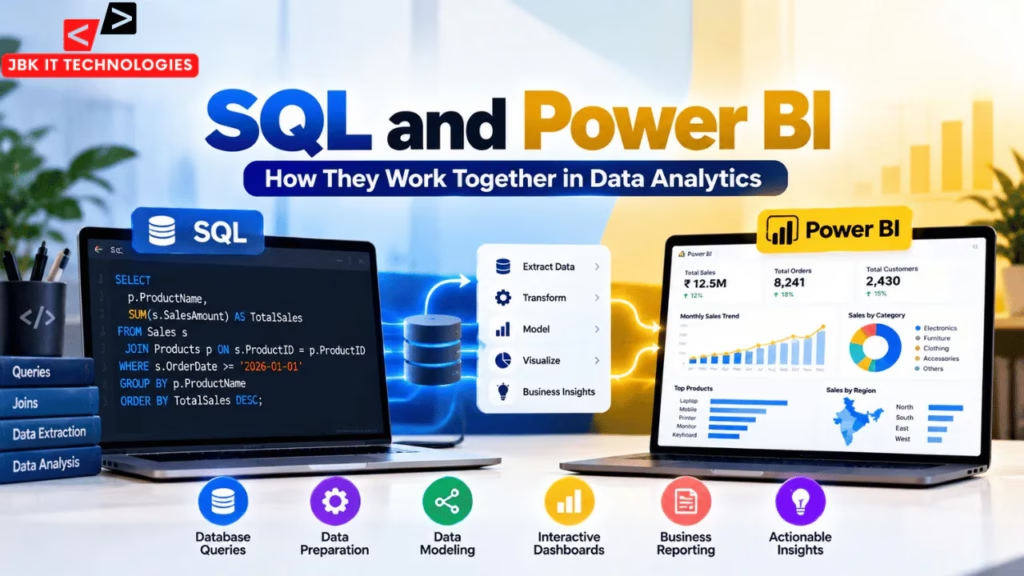
6. Practical Project: Build a Sales Analytics Report

A beginner can understand the SQL and Power BI workflow by creating a simple sales analytics project.

Project objective

Create a report that helps a fictional retail business understand revenue, product performance, and monthly sales trends.

Sample data structure

The project could use three tables:

Sales

  • OrderID

  • OrderDate

  • ProductID

  • Quantity

  • UnitPrice

  • Region

Products

  • ProductID

  • ProductName

  • Category

Customers

  • CustomerID

  • CustomerName

  • Region

For this example, assume each row in the Sales table represents a product line in an order, with quantity and unit price recorded for that line.

Step 1: Calculate sales using SQL

SELECT
    p.Category,
    SUM(s.Quantity * s.UnitPrice) AS TotalSales
FROM Sales AS s
INNER JOIN Products AS p
    ON s.ProductID = p.ProductID
GROUP BY p.Category
ORDER BY TotalSales DESC;

This query joins the sales records with product information, calculates line-level revenue, and summarises sales by category.

In a real project, check how discounts, returns, taxes, and cancellations are recorded before defining the final revenue calculation.

Step 2: Connect the data to Power BI

Connect Power BI to the database and load the required tables or query results.

For a project that needs several different views, loading appropriately modelled tables can be more flexible than importing only one pre-aggregated summary. This allows report users to examine results at different levels of detail.

Step 3: Build the report

Create visuals such as:

  • Total Sales: A card displaying overall revenue.

  • Monthly Trend: A line chart showing sales by month.

  • Category Comparison: A bar chart comparing product categories.

  • Regional Performance: A chart or table showing sales by region.

  • Product Details: A table listing products and their sales.

  • Date and Category Filters: Slicers that let users explore specific periods or product groups.

Step 4: Test the results

Compare the total sales shown in Power BI against a trusted SQL result. Test different date and category filters, and verify that the totals change as expected.

If the totals do not match, check joins, duplicate records, relationship definitions, filters, and the calculation logic.

Step 5: Explain the insights

The final project should not simply display charts. It should answer business questions.

For example, the report might reveal that one category contributes a large share of revenue or that sales decline during a particular month. The analyst should investigate the data and explain what the report shows without assuming a cause that the data cannot prove.

This project can become a useful portfolio example because it demonstrates data retrieval, transformation, modeling, visualisation, validation, and communication.

7. SQL and Power BI Skills to Learn

You do not need to master every advanced feature before building your first project. Start with the fundamentals and develop them through practice.

SQL skills

Learn the following concepts:

  • SELECT, FROM, and WHERE

  • ORDER BY and DISTINCT

  • Aggregate functions such as SUM(), COUNT(), and AVG()

  • GROUP BY and HAVING

  • Inner and outer joins

  • CASE expressions

  • Subqueries and common table expressions

  • Date and text functions

  • Basic window functions

  • Understanding primary keys, foreign keys, and table relationships

Practise writing queries against sample datasets and verify that you understand why each result is returned.

Power BI skills

Focus on:

  • Connecting to data sources

  • Power Query data cleaning and transformation

  • Data types and relationships

  • Fact and dimension tables

  • Data modeling

  • Basic DAX measures

  • Visualisation selection

  • Filters and slicers

  • Report layout and usability

  • Data refresh and publishing basics

  • Validation and performance troubleshooting

Supporting skills

SQL and Power BI become more useful when combined with spreadsheet knowledge, basic statistics, business understanding, and communication.

You should be able to explain what a metric represents, how it was calculated, and what limitations affect the interpretation.

8. Career Roles That Use SQL and Power BI

SQL and Power BI can be useful in several data-related roles, although individual job descriptions may require additional tools and experience.

Data Analyst: Retrieves, cleans, analyses, and interprets data to answer business questions.

Power BI Developer: Builds and maintains data models, DAX calculations, reports, and visualisation solutions.

Business Intelligence Analyst: Works with business teams to define metrics, analyse performance, and deliver reporting solutions.

Reporting Analyst: Prepares recurring operational, financial, sales, or performance reports and checks data accuracy.

MIS Executive or Analyst: Supports management information systems and prepares regular business reports, often using spreadsheets and reporting tools.

Junior Data Analyst: May support data extraction, quality checks, report maintenance, and basic analysis while developing more advanced skills.

SQL is often valuable for accessing and preparing data, while Power BI supports analysis and reporting. Other skills—such as Excel, statistics, Python, data warehousing, or cloud platforms—may be useful depending on the role.

A portfolio project that demonstrates both tools can help show how you approach a practical analytics task. It does not guarantee a job, but it provides evidence of your learning and problem-solving process.

9. Learning SQL and Power BI in Hyderabad and Dilsukhnagar

For learners exploring a SQL Power BI course in Dilsukhnagar or data analytics training in Hyderabad, a practical learning approach is to combine query writing with report development.

Start with sample business data, such as sales, inventory, attendance, or customer orders. Write SQL queries to answer clear questions, then connect the data to Power BI and create a report that communicates the findings.

When comparing training options, review whether the learning plan includes:

  • SQL fundamentals and hands-on query practice

  • Database joins and aggregation

  • Power Query and data cleaning

  • Power BI data modeling and DAX

  • Interactive report creation

  • Data validation and reporting exercises

  • A project that can be explained in a portfolio

You can also learn independently using official documentation and sample datasets. The key is to practise the entire workflow rather than learning SQL and Power BI as disconnected subjects.

10. Frequently Asked Questions

1. Do I need SQL for Power BI?

No. You can use Power BI with many supported data sources, including Excel files and other connectors, without writing SQL. However, SQL is valuable when working with relational databases, retrieving specific records, and understanding how data is organised.

2. Is SQL better than Power BI?

They serve different purposes. SQL is a language for querying relational databases, while Power BI is a platform for data preparation, modeling, analysis, and reporting. Many analytics workflows benefit from using both.

3. Should I learn SQL or Power BI first?

If you are completely new to data analytics, learning basic SQL before or alongside Power BI is a useful approach. Start with simple queries, then practise connecting data to Power BI and creating reports. You can adjust the order based on your goals and prior knowledge.

4. Can Power BI connect directly to a SQL database?

Yes. Power BI supports connectors for SQL Server and other supported database systems. The connection method and available features depend on the database, connector, authentication, and selected connectivity mode.

5. What is the difference between SQL and DAX?

SQL is used to query relational databases and perform operations on data. DAX is a formula language used in Power BI and other Microsoft tabular data models to create calculations and measures. They have different purposes and are not interchangeable.

6. Is Excel required before learning SQL and Power BI?

No. You can start learning SQL and Power BI without advanced Excel knowledge. However, familiarity with rows, columns, formulas, tables, and basic reporting can make data analytics concepts easier to understand.

7. What project can beginners build with SQL and Power BI?

A sales analytics report is a useful starting project. Use SQL to retrieve and summarise sales data, connect the relevant tables to Power BI, create measures and charts, validate the totals, and explain the main findings.

8. How long does it take to learn SQL and Power BI?

You can learn basic concepts and build a small project in a few weeks with consistent practice. Becoming proficient requires more time, especially when working with complex queries, data models, DAX, performance issues, and real-world data quality challenges.

9. Can SQL and Power BI help me become a data analyst?

Both tools are relevant to many data analyst roles. However, employers may also expect problem-solving, communication, business knowledge, data quality awareness, spreadsheet skills, and other technical capabilities.

10. Where can I practise SQL and Power BI?

Use sample databases, practice datasets, and the official learning resources for SQL and Power BI. Start with small questions, build a report, validate the results, and gradually increase the complexity of your projects.

Enquiry Form