Ameerpet Hyderabad

Call Now : 9390612347

Dilsukhnagar Hyderabad

Call Now : 8096061003

Mehdipatnam Hyderabad

Call Now : 9000709021

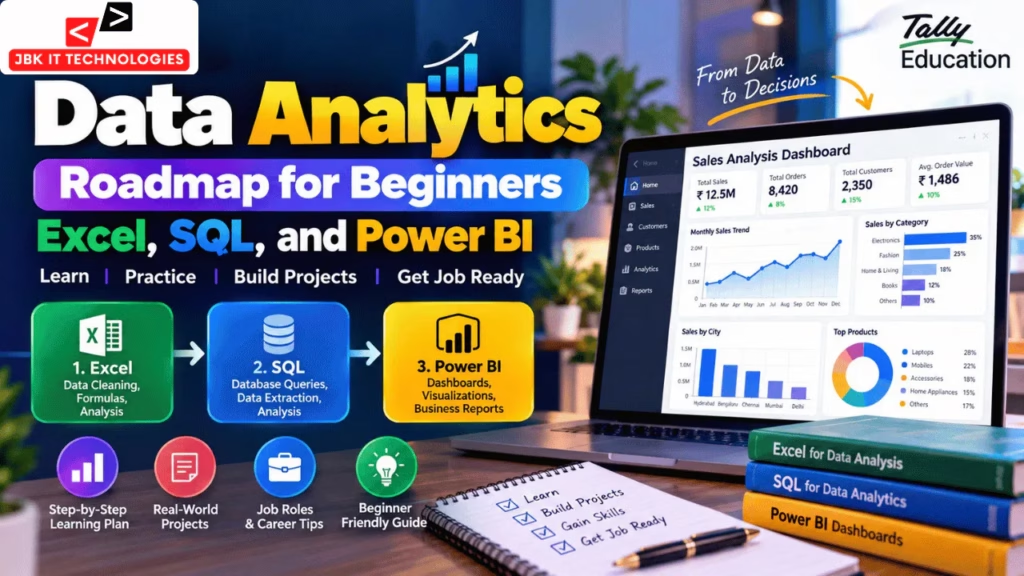
Data Analytics Roadmap for Beginners: Excel, SQL, and Power BI

Data is now used by businesses of almost every size to understand customers, monitor performance, track sales, manage operations, and make better decisions. As the amount of business data continues to grow, companies need professionals who can collect, clean, analyze, visualize, and communicate information clearly.

This has made data analytics an attractive career area for people from different educational and professional backgrounds.

But beginners often have one important question:

Where should I start learning data analytics?

There are many tools available, including Excel, SQL, Power BI, Python, Tableau, and other analytics platforms. Trying to learn everything at once can make the process confusing.

A better approach is to follow a structured data analytics roadmap.

For many beginners, a practical starting path is:

Excel → SQL → Power BI → Projects → Business Reporting → Portfolio → Job Preparation

Excel helps you understand and clean data. SQL teaches you how to retrieve information from databases. Power BI helps you transform data into interactive dashboards and reports. Practical projects then help you combine these skills into a realistic workflow.

This guide explains how beginners can follow a step-by-step data analytics roadmap, what to learn at each stage, which projects to practice, and how to build job-ready skills.

What Is Data Analytics?

Data analytics is the process of examining data to identify useful information, patterns, trends, relationships, and insights that can support decision-making.

A typical analytics process can be represented as:

Raw Data → Cleaning → Analysis → Visualization → Insights → Decision

For example, imagine an online store has thousands of sales records.

The raw data may contain:

  • Order ID
  • Customer name
  • Product
  • Quantity
  • Price
  • Order date
  • Location
  • Payment method

A data analyst can use this information to answer questions such as:

  • Which products generate the most revenue?
  • Which month had the highest sales?
  • Which locations perform best?
  • What is the average order value?
  • Which products are declining in sales?
  • Which customer segment purchases most frequently?

The objective isn’t simply to create charts.

The objective is to turn data into useful information for decision-making.

Why Should Beginners Learn Data Analytics?

Data analytics combines technical skills with business thinking.

A beginner does not necessarily need to become an advanced programmer before starting.

Instead, it is useful to develop skills in stages.

The basic roadmap can be divided into six areas:

  1. Data and business fundamentals
  2. Excel
  3. SQL
  4. Power BI
  5. Practical projects
  6. Portfolio and job preparation

Each stage builds on the previous one.

Data Analytics Roadmap for Beginners

A simple learning path looks like this:

Data Fundamentals
        ↓
Excel
        ↓
Data Cleaning
        ↓
SQL
        ↓
Power BI
        ↓
Dashboards
        ↓
Practical Projects
        ↓
Portfolio
        ↓
Job Preparation

You can later add Python, statistics, cloud platforms, or advanced analytics depending on your career goals.

However, beginners should first build a strong foundation rather than trying to learn every analytics tool simultaneously.

Step 1: Understand the Basics of Data Analytics

Before learning software, understand what data actually represents.

Start with basic concepts such as:

  • Rows and columns
  • Data types
  • Numerical data
  • Text data
  • Dates
  • Categories
  • Measures
  • Dimensions
  • Records
  • Variables
  • KPIs
  • Trends
  • Percentages
  • Averages

You should also understand the difference between raw data and processed information.

For example:

Raw data:

ProductSales
Laptop₹50,000
Monitor₹20,000
Keyboard₹5,000

After analysis, you might determine:

Total Sales = ₹75,000

The calculation itself is simple, but the important skill is understanding what the result means.

Step 2: Learn Excel for Data Analytics

Excel is an excellent starting point for beginners because it allows you to work with data in a visual and accessible environment.

The goal isn’t simply to learn basic spreadsheet formatting.

You should learn how to use Excel to clean, analyze, summarize, and present data.

Important Excel Skills

Start with:

  • Worksheets
  • Rows and columns
  • Cell references
  • Formatting
  • Sorting
  • Filtering
  • Tables
  • Basic formulas
  • Functions
  • Charts
  • Conditional formatting

Then progress toward more analytical functions.


Important Excel Functions for Beginners

Some useful functions include:

SUM

Used to calculate totals.

=SUM(B2:B20)
AVERAGE

Used to calculate an average.

=AVERAGE(B2:B20)
COUNT

Counts numerical values.

=COUNT(B2:B20)
COUNTIF

Counts records based on a condition.

=COUNTIF(C2:C20,"Hyderabad")

SUMIF

Calculates totals based on a condition.

=SUMIF(C2:C20,"Hyderabad",D2:D20)
IF

Used for logical conditions.

=IF(D2>=50000,"High","Low")

You should eventually become comfortable with lookup functions, logical functions, text functions, date functions, and conditional calculations.

Step 3: Learn Excel Data Cleaning

Data rarely arrives perfectly organized.

You may encounter:

  • Duplicate records
  • Missing values
  • Incorrect spellings
  • Extra spaces
  • Inconsistent dates
  • Incorrect formats
  • Empty cells
  • Duplicate customer names

Data cleaning is therefore an important analytics skill.

For example:

Hyderabad
hyderabad
HYDERABAD
Hyderbad

These may represent the same location but are stored differently.

Before analyzing the information, you need to standardize it.

Useful Excel features for data preparation include:

  • Remove Duplicates
  • Sort
  • Filter
  • Find and Replace
  • Text functions
  • Date functions
  • Data validation
  • Power Query

Step 4: Learn Pivot Tables

Pivot Tables are one of the most useful Excel features for data analysis.

Suppose you have 10,000 sales records.

Instead of manually calculating sales for every city, product, and month, a Pivot Table can summarize the information.

You could create:

Rows: City

Columns: Month

Values: Sales

This can quickly show which locations and months generate the highest sales.

Learn how to use:

  • Rows
  • Columns
  • Values
  • Filters
  • Grouping
  • Calculated fields
  • Pivot Charts

Pivot Tables also help beginners understand how analytical summaries are created.

Step 5: Learn Basic Data Visualization

Analytics is not only about calculations.

You also need to communicate results.

Learn how to select suitable charts for different situations.

Bar Chart

Useful for comparing categories.

Line Chart

Useful for showing trends over time.

Pie or Donut Chart

Can be useful for simple proportions when there are only a few categories.

Column Chart

Useful for comparing values across categories or periods.

Scatter Chart

Useful for examining relationships between numerical variables.

The goal is not to use the most complicated chart.

The goal is to make the information easy to understand.

Step 6: Learn SQL

After building an Excel foundation, beginners can move to SQL.

SQL stands for Structured Query Language.

It is widely used to work with data stored in relational databases.

While Excel is often useful for spreadsheet-based analysis, SQL allows you to retrieve and manipulate data directly from databases.

A typical analytics workflow might look like:

Database → SQL Query → Dataset → Power BI → Dashboard


SQL Topics Beginners Should Learn

Start with basic queries.

SELECT

Used to retrieve data.

SELECT *
FROM customers;
WHERE

Used to filter records.

SELECT *
FROM customers
WHERE city = 'Hyderabad';
ORDER BY

Used to sort results.

SELECT *
FROM sales
ORDER BY revenue DESC;
GROUP BY

Used to summarize data.

SELECT city, SUM(revenue)
FROM sales
GROUP BY city;
JOIN

Used to combine related tables.

For example:

Customers
    +
Orders
    ↓
Combined Dataset

Beginners should gradually learn:

  • SELECT
  • WHERE
  • ORDER BY
  • GROUP BY
  • HAVING
  • DISTINCT
  • Aggregate functions
  • INNER JOIN
  • LEFT JOIN
  • CASE
  • Subqueries
  • Common Table Expressions
  • Window functions

You don’t need to learn every advanced SQL concept on your first day.

Build your skills progressively.

Step 7: Understand Databases

SQL becomes easier when you understand how databases are structured.

Learn basic concepts such as:

  • Tables
  • Rows
  • Columns
  • Primary keys
  • Foreign keys
  • Relationships
  • Records
  • Database schemas

For example:

Customers Table

Customer_IDCustomer_NameCity
101RaviHyderabad
102PriyaBengaluru

Orders Table

Order_IDCustomer_IDAmount
501101₹2,500
502102₹4,000

The Customer_ID can connect the two tables.

Understanding relationships becomes particularly important when working with Power BI models.

Step 8: Learn Power BI

After learning Excel and SQL basics, the next major step in this roadmap is Power BI.

Power BI is used to connect to data, transform it, create data models, build visualizations, and develop interactive reports and dashboards.

For beginners, Power BI can bring together skills learned from Excel and SQL.

A typical workflow is:

Data Source

↓

Power Query

↓

Data Model

↓

DAX

↓

Visualizations

↓

Dashboard

Step 9: Learn Power Query

Power Query is important for preparing data before analysis.

You can use it to:

  • Remove unnecessary columns
  • Change data types
  • Remove duplicates
  • Replace values
  • Split columns
  • Merge datasets
  • Append datasets
  • Filter records
  • Transform data

For example, imagine receiving monthly sales files:

January.xlsx
February.xlsx
March.xlsx
April.xlsx

Instead of manually copying everything into one spreadsheet, Power Query can help create a repeatable transformation workflow.

This is an important step toward more efficient data preparation.

Step 10: Learn Data Modeling

Data modeling is another important Power BI skill.

Instead of putting everything into one large table, data can be organized into related tables.

For example:

Customers
    |
    |
Sales
    |
    |
Products

You should understand:

  • Relationships
  • Primary keys
  • Foreign keys
  • Fact tables
  • Dimension tables
  • Star schema basics

A good data model can make reports easier to build and maintain.

Step 11: Learn DAX Basics

DAX stands for Data Analysis Expressions.

It is used in Power BI for calculations and analytical logic.

Beginners should start with simple measures.

For example:

Total Sales = SUM(Sales[Amount])

Another example:

Total Quantity = SUM(Sales[Quantity])

Then gradually learn:

  • CALCULATE
  • FILTER
  • SUMX
  • COUNTROWS
  • DISTINCTCOUNT
  • DIVIDE
  • Date calculations
  • Time intelligence

Don’t try to memorize hundreds of DAX functions.

Focus on understanding why a calculation is needed and how it works.

Step 12: Build Power BI Dashboards

A dashboard should answer business questions.

For example, a sales dashboard could contain:

KPI Cards

  • Total Sales
  • Total Orders
  • Total Customers
  • Average Order Value

Charts

  • Monthly sales trend
  • Sales by product
  • Sales by city
  • Sales by category

Filters

  • Date
  • Location
  • Product
  • Category

A good dashboard should make important information easy to find.

Step 13: Learn Business Reporting

Technical skills alone aren’t enough.

A data analyst also needs to understand the business question behind the analysis.

Suppose a company asks:

“Why did sales decrease last month?”

A weak analysis might simply show a chart.

A stronger analysis might investigate:

  • Product performance
  • Location performance
  • Customer segments
  • Sales channels
  • Monthly trends
  • Order volume
  • Average order value

Then the analyst can communicate the findings clearly.

This is where business understanding becomes important.

Step 14: Work on Practical Data Analytics Projects

Projects are one of the most important parts of the roadmap.

Instead of only watching tutorials, use real or realistic datasets.

Start with simple projects.

Project 1: Sales Analysis

Dataset:

  • Order ID
  • Product
  • Category
  • Date
  • Quantity
  • Revenue
  • City

Questions:

  • What are total sales?
  • Which product sells the most?
  • Which city generates the most revenue?
  • What is the monthly sales trend?

Tools:

Excel + Power BI


Project 2: Customer Analysis

Analyze customer information to identify:

  • Number of customers
  • Repeat customers
  • Customer locations
  • Average purchase value
  • High-value customers

Tools:

Excel + SQL + Power BI


Project 3: HR Analytics

Create an employee dataset containing:

  • Employee ID
  • Department
  • Salary
  • Experience
  • Age
  • Joining date
  • Job role

Analyze:

  • Employee count
  • Department distribution
  • Average salary
  • Experience levels
  • Employee turnover

Project 4: E-Commerce Dashboard

Build a dashboard showing:

  • Revenue
  • Orders
  • Products
  • Categories
  • Customers
  • Locations
  • Monthly performance

This project is particularly useful because it combines several analytics concepts.


Project 5: Financial Reporting

Create a simple financial dataset and analyze:

  • Revenue
  • Expenses
  • Profit
  • Monthly performance
  • Budget vs actuals

This project can help you understand business reporting concepts.

A 30-Day Data Analytics Learning Plan

Beginners who want a structured starting point can divide their first month into four stages.

Days 1–7: Excel

Focus on:

  • Excel interface
  • Tables
  • Sorting
  • Filtering
  • Formulas
  • Functions
  • Charts
  • Data cleaning

Practice: Create a small sales analysis report.


Days 8–14: Advanced Excel + Data Preparation

Learn:

  • Pivot Tables
  • Pivot Charts
  • Lookup functions
  • Conditional calculations
  • Text functions
  • Date functions
  • Power Query basics

Practice: Clean and summarize a messy sales dataset.


Days 15–21: SQL

Learn:

  • SELECT
  • WHERE
  • ORDER BY
  • GROUP BY
  • HAVING
  • Aggregate functions
  • JOIN
  • CASE

Practice: Answer business questions using a sample database.


Days 22–30: Power BI

Learn:

  • Data import
  • Power Query
  • Data modeling
  • Relationships
  • Basic DAX
  • Visualizations
  • Filters
  • Dashboard design

Practice: Build a complete sales dashboard.

At the end of 30 days, you won’t be an advanced data analyst—but you can have a strong foundation and a clear direction for further learning.

What Skills Should a Data Analyst Learn?

A beginner data analyst roadmap can be divided into technical and soft skills.

Technical Skills

  • Excel
  • SQL
  • Power BI
  • Data cleaning
  • Data visualization
  • Data modeling
  • Basic statistics
  • Reporting
  • Basic database concepts

Business Skills

  • Problem solving
  • Business understanding
  • KPI analysis
  • Critical thinking
  • Requirement understanding

Communication Skills

  • Presenting insights
  • Writing reports
  • Explaining dashboards
  • Communicating findings
  • Storytelling with data

Should Beginners Learn Python?

Python is valuable in data analytics, but beginners don’t necessarily need to start with it.

A practical sequence could be:

Excel → SQL → Power BI → Python

Once you understand data cleaning, querying, visualization, and business analysis, Python can expand your capabilities.

Python becomes particularly useful for:

  • Data manipulation
  • Automation
  • Statistical analysis
  • Large datasets
  • Advanced analytics
  • Machine learning

Useful Python libraries later include:

  • Pandas
  • NumPy
  • Matplotlib
  • Seaborn

However, the right learning sequence depends on your career goals.

Common Mistakes Beginners Make

Trying to Learn Every Tool

You don’t need Excel, SQL, Power BI, Python, Tableau, R, cloud platforms, and machine learning simultaneously.

Start with a manageable stack.

Only Watching Tutorials

Watching tutorials without practicing can create the illusion of learning.

Build projects.

Ignoring Data Cleaning

Real-world datasets are rarely perfect.

Cleaning is a major part of analytics.

Focusing Only on Visuals

A beautiful dashboard isn’t useful if it doesn’t answer a business question.

Ignoring SQL

SQL is an important skill for working with database-driven data.

Not Creating a Portfolio

Your projects demonstrate how you apply your skills.

How to Build a Data Analytics Portfolio

A beginner portfolio could contain four to six projects.

For example:

Project 1

Excel Sales Analysis

Project 2

SQL Customer Analysis

Project 3

Power BI Sales Dashboard

Project 4

HR Analytics Dashboard

Project 5

E-Commerce Analytics

For each project, explain:

  1. Business problem
  2. Dataset
  3. Tools used
  4. Data-cleaning process
  5. Analysis
  6. Dashboard
  7. Key insights
  8. Recommendations

This makes the project easier for another person to understand.

Data Analytics Job Roles

Once you develop the required skills and practical experience, possible career paths can include roles such as:

  • Data Analyst
  • Business Analyst
  • Reporting Analyst
  • MIS Analyst
  • BI Analyst
  • Junior Data Analyst
  • Data Visualization Analyst

The exact responsibilities vary between companies.

For example, a reporting-focused role may involve Excel and dashboard preparation, while a BI-focused role may require stronger SQL, Power BI, and data-modeling skills.

Data Analytics Course in Dilsukhnagar and Hyderabad

People searching for a data analytics course in Dilsukhnagar or data analytics training in Hyderabad should compare courses based on the actual skills and practical work included.

A useful curriculum should ideally cover:

  • Excel
  • Advanced Excel
  • SQL
  • Data cleaning
  • Power BI
  • Data visualization
  • Data modeling
  • DAX basics
  • Dashboard creation
  • Business reporting
  • Practical projects

Rather than choosing a program only because it lists many tools, beginners should check whether they will actually work with datasets and create complete projects.

Frequently Asked Questions

How can beginners start learning data analytics?

Beginners can start with Excel, then learn SQL and Power BI. After developing the fundamentals, they should practice with real-world datasets and build projects.

Is Excel necessary for data analytics?

Excel is not the only data analytics tool, but it is a useful starting point for understanding data cleaning, formulas, Pivot Tables, analysis, and reporting.

Should I learn SQL or Power BI first?

A practical sequence is to learn basic Excel first, then SQL, followed by Power BI. However, you can also learn SQL and Power BI in parallel once you understand basic data concepts.

Is Power BI difficult for beginners?

Power BI has many features, but beginners can start with importing data, Power Query, basic visualizations, relationships, simple DAX, and dashboard creation.

How long does it take to learn data analytics?

The time required depends on your background, learning schedule, and goals. A beginner can build foundational skills over several weeks, while becoming job-ready typically requires continued practice and multiple projects.

Can a non-technical person learn data analytics?

Yes. Beginners from different educational backgrounds can learn data analytics. The important requirements are logical thinking, willingness to work with data, and consistent practice.

Is SQL required for a data analyst?

SQL is an important skill for many data analyst roles because analysts often need to retrieve and analyze information stored in databases.

Should I learn Python after Power BI?

Python can be a useful next step after building a foundation in Excel, SQL, and Power BI. It becomes especially useful for automation, advanced data analysis, statistics, and machine learning.

What projects should beginners create?

Good beginner projects include sales analysis, customer analysis, HR analytics, e-commerce dashboards, financial reporting, and marketing analytics.

Can I become a data analyst by learning Excel, SQL, and Power BI?

These three tools can provide a strong foundation, but job requirements vary. You should also develop data-cleaning, business analysis, visualization, communication, and problem-solving skills.


Enquiry Form